Last updated on Wednesday, April 28, 2021
Today I will show how easy it is to put JET Spark Charts in Interactive Grid cells. JET Spark Charts are an implementation of the sparkline graphical style. I recommend learning about them from Edward Tufte’s books.
[Updated 19-Oct-2020][Updated 28-Apr-2021 for 21.1]
Rather than just give a recipe I’ll take you through my process of figuring things out in the hopes that it does more to educate than to confuse. My starting goal was to simply get a static spark chart displayed on an APEX page. To a blank page I added a Static Content region with this markup in it:
<p>...
<oj-spark-chart class="inline-spark" id="sparkLine1" type="line"
        items="[5, 8, 2, 7, 0, 9, 2, 3, 4, 2]" color="red" line-width="2">
</oj-spark-chart>
...</p>
I learned the markup from the JET cookbook and oj-spark-chart element documentation. I only gave it an id so I could mess with it from the JavaScript console if needed. I figured the class may come in handy since I saw the JET examples using inline styles. I ran the page and got no errors and also no spark chart. This is expected because the necessary JET libraries are not loaded.
For most libraries that you want to play around with in APEX you simply list the needed library file(s) in the page attribute JavaScript File URLs. You can either reference them from a CDN, or your own web server, or you can load them as application static files. Then you can start using the library from anywhere on the page or even from the JavaScript console. But things are not so simple with JET. JET uses RequireJS to load specific modules and their dependencies. I have written about using RequireJS, JET, and APEX before and since then APEX has added the [require requirejs] and [require jet] JavaScript file URLs prefix syntax to make it easier to use JET with APEX.
So we know that we need to use this [require jet] syntax but the question is what file to load. Well it should be your own JavaScript file that contains a call to require such as:
require([ list of modules needed ], function() {
   code that uses the modules
});
The trouble is that I don’t expect using spark charts to need much code and to just play around with it seems like creating a file shouldn’t be necessary. But some file is required. It can even be an empty file. Yes it is true in the end you may, and probably should, turn your experiments into a plug-in or at least move the code into files for greater reuse and modularity but it is nice to be able to try things out with as little setup as necessary. This means putting code inline on the page and even running code from the JavaScript console.
You might be tempted to try loading the combined JET file oj.js reasoning that it contains everything so it should provide what you need to use any given JET component. I have never gotten this to work! There are many 3rd party dependencies that need to be loaded and even after that I still get errors about missing symbols. I have given up on this because oj.js is huge, I don’t need most of it, and I don’t want dependencies like Knockout anyway.
Sometimes, depending on what JET elements you want to use, simply having an APEX component that uses JET on the page provides the necessary setup. Doing nothing more than adding a JET chart to the page is almost enough to display the spark chart. Well it did something because now there is a warning in the console that it failed to load knockout.js.
What is going on? I’m not using Knockout so it shouldn’t try to load it. Notice that the above markup uses <oj-spark-chart>. This is a custom HTML element (also known as a web component or JET Custom Element). This is very different from the old widget style of component initialization where you would have a normal HTML element like div or span and then turn it into something with code such as $("#selector").someWidget({...}). Custom HTML elements are initialized automatically. They are configured with attributes rather than an options object. By default JET uses Knockout to bind dynamic data from a data model to various attributes. But this can be turned off and you can see that all the attributes in the markup above are static values so no binding is needed. To turn off Knockout data binding the element or any of its ancestors needs to have the attribute:
data-oj-binding-provider="none"
I think in the future APEX may put this attribute on the page <body> element automatically. [Update: as of APEX 19.2 data-oj-binding-provider is automatically set to none so you don’t need to do this step. See note below.] You could do this today by modifying the page template. You could also add the attribute to each JET element but this would become tedious. The simplest thing to do is put it in the page attribute Page HTML Body Attribute. The following code in the page attribute Function and Global Variable Declaration or in your own JavaScript file will do the same thing:
$(document.body).attr("data-oj-binding-provider", "none");
To summarize I started with a blank APEX page. Added a Static Content region with markup given above. Then added a JET Chart region as a trick just to get the JET libraries loaded. And added data-oj-binding-provider="none" to page attribute Page HTML Body Attribute. To make the sparkline fit in a little better in a paragraph I added the following inline CSS:
.inline-spark {
    display: inline-block;
    width: 100px;
    height: 24px;
    vertical-align: middle;
}
The result, without a single line of JavaScript code, is this region:
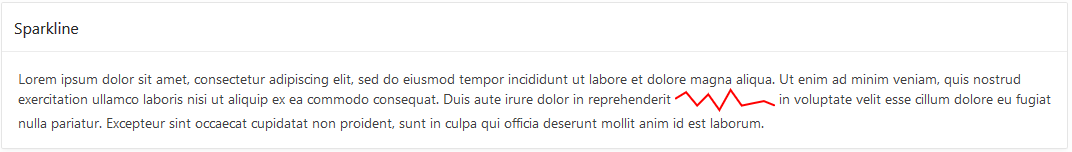
Considering that a sparkline is “a small intense, simple, word-sized graphic” putting it inside a paragraph like this is a reasonable use case. But my ultimate goal was to put it in interactive grid cells and I’ll get to that shortly. First there are two problems with what I have shown so far 1) the sparkline data values are hard coded, and 2) there is an unwanted chart on the page.
You can probably think of a number of ways for APEX to generate different data to render on the server side. The data should be formatted as a JSON array. It could be generated by a PL/SQL Dynamic Content region, or use a substitution, or use a Display Only item. A region plug-in doesn’t make sense for Spark Chart but an item plug-in could make sense for some use cases. But as this paragraph example shows Spark Charts can be used in many places where items don’t make sense. For now I’ll leave creating a Spark Chart item plug-in to someone else.
If you want to set or change the data on the client side it is easy to do with code such as:
$("#sparkLine1")[0].items = [1,3,2,4,5,6,1,4,3,4,5,2.5];
You can change the item values any time you like after the element has been initialized. Note the [0] after the jQuery object. This is because web components extend the methods and properties of DOM elements. You could use this equivalent code:
document.getElementById("sparkLine1").items = [1,3,2,4,5,6,1,4,3,4,5,2.5];
I said you can set the items array property after the element is initialized but when is that? If you want to set the items as soon as possible after the page loads and the element is initialized you will need to wait on a JET busyContext. For example in Execute when Page Loads you could do something like this:
require(["ojs/ojcore", "ojs/ojchart"], function(oj) {
    var sparkLine1 = document.getElementById("sparkLine1");
    var busyContext = oj.Context.getContext(sparkLine1).getBusyContext();
    busyContext.whenReady().then(function() {
        sparkLine1.items = [1,3,2,4,5,6,1,4,3,4,5,34];
    });
});
Now lets get rid of the unwanted chart. As we have seen it doesn’t take any code to initialize the Spark Chart so the question is what is the minimum necessary to get the needed JET libraries loaded. It turns out not much. Create a file called sparkchart.js with this one line as the content:
require(["ojs/ojchart"], function() {});
Then add it to Shared Components > Static Application Files and add a reference to the file in the page attribute JavaScript File URLs like this:
[require jet]#APP_IMAGES#sparkchart.js
This feels like a waste of a round trip to the sever for such a small file. If you already have an application JavaScript file consider adding this line to it. It seems like APEX should do something to make simple things like this easier.
[Update 2021: Now APEX does make it easier. Starting in APEX 21.1 the [require jet] prefix command syntax does not require a file to follow it. This means that working with simple JET elements doesn’t force you to use a file just to call require. It is as easy as:
- Add
[require jet]to page attribute JavaScript File URLs. - Add
#JET_CSS_DIRECTORY#redwood/oj-redwood-notag-min.cssto page attribute CSS File URLs. - Add
require(["ojs/ojchart"], function() {});to page attribute Execute when Page Loads. Or for example to use sparkchart and
avatar userequire(["ojs/ojchart", "ojs/ojavatar"], function() {});.
Another change in 21.1 is that the file “libraries/apex/requirejs.jetConfig.js” is now loaded even when using [require jet] or [require requirejs]. This is done because APEX libraries make use of some JET resource files. It fixed a problem where using requirejs but not JET would break some apex.locale functions.]
To the page CSS File URLs add:
#JET_CSS_DIRECTORY#alta/oj-alta-notag-min.css
Now you can remove the Chart region. Taking a step back and realizing that once the JET libraries are loaded the Spark Chart is just markup it should be clear how to add them to Interactive Grid or other kinds of reports.
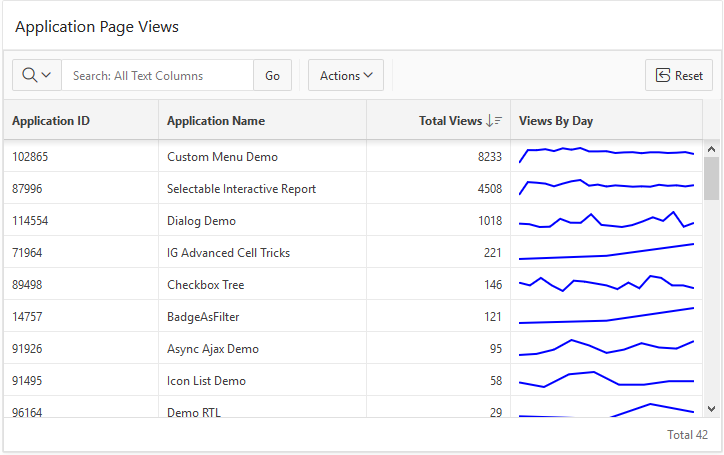
Here is an example. Add an Interactive Grid to the page with Title = Application Page Views. Set the SQL Query to:
select
    application_id,
    application_name,
    (select count(*) from apex_activity_log where flow_id = ap.application_id) total_views,
    case when (select count(*) from apex_activity_log where flow_id = ap.application_id) > 0 then
        (select json_arrayagg(views)
             from (select trunc(TIME_STAMP) day, to_char(TIME_STAMP,'mm/dd/yyyy') day_format, count(*) views
                 from apex_activity_log where flow_id = ap.application_id
                 group by trunc(time_stamp),to_char(time_stamp,'mm/dd/yyyy')
                 order by trunc(time_stamp) desc))
    else
        '[]'
    end views_by_day
from apex_applications ap
This uses json_arrayagg to create the JSON array. If you have a database version less than 12.2 then you will have to make due without json_arrayagg. I managed to figure out how to use lastagg. It was a lot of fun learning and figuring out how to use the new JSON database capabilities. Figuring out this SQL query was the hardest part for me. Feel free to tell me how it can be done better.
Run the page as is just to see that the Views By Day column contains a JSON Array of numbers.
The last step is to change the VIEWS_BY_DAY column type to HTML Expression and enter this expression:
<oj-spark-chart id="sparkLine1"
  type="line"
  items="&VIEWS_BY_DAY."
  color="blue"
  line-width="2"
  class="cell-spark"></oj-spark-chart>
That is essentially all it takes. I changed a few other IG declarative attributes and added the following CSS rule so the sparkline would fill the whole cell.
.cell-spark {
    width: 100%;
}
I also I tweaked the report settings. The result can be seen in the screen shot at the start of this blog. It should be clear how Spark Charts can be used in Interactive Reports and Classic Reports. A nice thing about the IG implementation of HTML Expression columns is that the template is evaluated on the client so only the data is sent to the client not all the markup repeated for each cell.
It should be possible to do something very similar with the JET Avatar element but it seems to have a dependency on knockout that can’t be shaken.
[Update the avatar element works in later versions of JET that ship with APEX 19.2 and later. See the IG Cookbook for 19.2 page 37 for an example.]
[Update 2021: Note
To be clear the data-oj-binding-provider=”none” attribute is added to the form element by the APEX engine. The benefit is that it is consistent no matter what page template is used. This means it doesn’t apply to inline dialogs and popups so you may need to add it there manually. A future release of APEX may do it automatically.]
Have fun adding these new data visualizations to your APEX apps.